

What would happen to the SML graph in Figure 8.8 if expected inflation increased or decreased? Figure
Question:
What would happen to the SML graph in Figure 8.8 if expected inflation increased or decreased?
Figure 8.8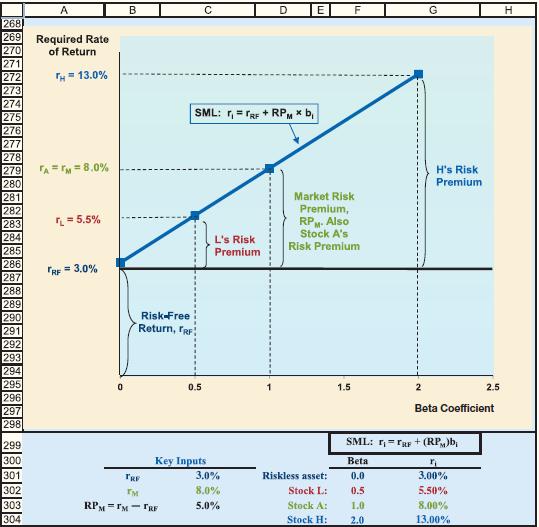
Step by Step Answer:

This question has not been answered yet.
You can Ask your question!
Related Book For 

Fundamentals Of Financial Management
ISBN: 9780357517574
16th Edition
Authors: Eugene F. Brigham, Joel F. Houston
Question Posted:
