

The following table shows 2017 total revenues, cost of goods sold, earnings available for common stockholders, total
Question:
The following table shows 2017 total revenues, cost of goods sold, earnings available for common stockholders, total assets, and stockholders’ equity for three companies competing in the bottled drinks market: the Coca-Cola Company, PepsiCo Inc., and Dr. Pepper Snapple Group. All dollar values are in thousands.
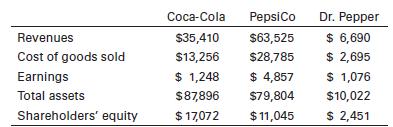
a. Use the information given to analyze each firm’s profitability in as many different ways as you can. Which company is most profitable? Is this a difficult question to answer?
b. For each company, ROE is greater than ROA. Why is that so? Look at the difference between ROE and ROA for each company. Does that difference help you determine which firm uses the highest percentage of debt to finance its activities?
Step by Step Answer:
The information given in the table can be used to analyze each firms profitability in several different ways One way is to calculate each firms profit ...View the full answer


Fundamentals Of Investing
ISBN: 9780135175217
14th Edition
Authors: Scott B. Smart, Lawrence J. Gitman, Michael D. Joehnk
