Beta is a common measure of stock-market risk or volatility. It is typically estimated as the slope
Question:
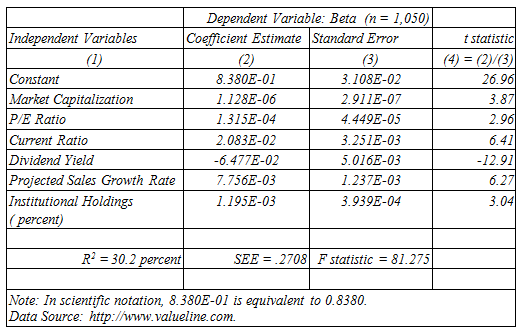
Savvy investors need to be aware of stock-price volatility. Long-term investors often seek out high-beta stocks to gain added benefit from the long-term upward drift in stock prices that stems from economic growth. When a short-term dip in stock prices (bear market) is expected, investors may wish to avoid high-beta stocks to protect themselves from a market downturn. The table below shows estimation results for a multiple regression model that relates beta to seven fundamental determinants of stock-price volatility. Market capitalization reflects the market value of the firm€™s common stock, and is a measure of firm size. The P/E ratio is the firm€™s stock price divided by earnings per share for the current 12-month period. It shows how much current investors are willing to pay for each dollar of earnings. The current ratio is the sum of current assets divided by the sum of current liabilities, and is a traditional indicator of financial soundness. Dividend yield is common dividends declared per share expressed as a percentage of the average annual price of the stock. Projected sales growth is the projected gain in company revenues over the next 3-5 years. Finally, institutional holdings are the percentage of a company€™s stock that is owned by institutions, such as mutual funds, investment companies, pension funds, etc.
A. How would you interpret the finding for each individual coefficient estimate?
B. How would you interpret findings for the overall regression model?
StocksStocks or shares are generally equity instruments that provide the largest source of raising funds in any public or private listed company's. The instruments are issued on a stock exchange from where a large number of general public who are willing...
Step by Step Answer:
A First of all the constant in such a regression model typically has no meaning Clearly the intercept should not be used to estimate beta for a stock ...View the full answer