Question:
One of the most difficult tasks facing stock market investors is the accurate projection of EPS growth. Historical EPS growth is only relevant for investors as an indicator of what might be reasonable to expect going forward. This is trickier than it sounds. For example, rapid historical EPS growth is typically associated with firms that offer distinctive products and display shrewd management of corporate assets. Although continuing EPS growth is sometimes enjoyed, it is never guaranteed. Past success can even become a hindrance to future EPS growth. For example, the amazing EPS growth historically displayed by Microsoft Corp. makes it difficult for the firm to sustain similarly high rates of EPS growth in the future. (Elephants seldom run as fast as gazelles.)
The table shows the relationships between EPS growth estimates obtained from The Value Line Investment Survey and the historical 1-year, 5-year, and 10-year rates of growth in EPS. All figures are in percentage terms.
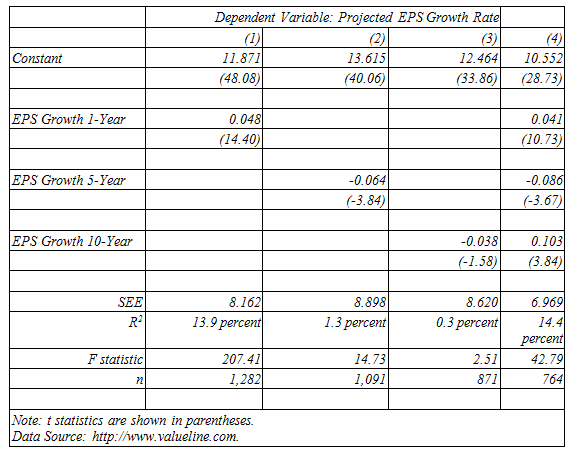
A. Consider each of the three simple regressions that relate projected EPS growth and the 1-year, 5-year or 10-year historical rates of growth in EPS [models (1), (2), and (3)]. Which of these models does the best job of explaining projected EPS growth? Why? How would you interpret these findings?
B. The multiple regression model that relates projected EPS growth to 1-year, 5-year and 10-year historical EPS growth [model (4)] has the highest R2 and overall explanatory power of any model tested. Is this surprising? Why or why not?
Transcribed Image Text:
Dependent Variable: Projected EPS Growth Rate (3) 12.464 (1) (2) 13.615 (4) 10.552 (28.73) Constant 11.871 (48.08) (40.06) (33.86) 0.048 (14.40) EPS Growth 1-Year 0.041 (10.73) EPS Growth 5-Year -0.064 -0.086 (-3.84) (-3.67) EPS Growth 10-Year -0.038 0.103 (3.84) (-1.58) 8.898 6.969 14.4 percent 42.79 764 SEE 8.620 8.162 13.9 percent 1.3 percent 0.3 percent R? 207.41 1,282 14.73 1,091 F statistic 2.51 871 Note: t statistics are shown in parentheses. Data Source: http://www.valueline.com.