

Mortality data for patients in the intensive care unit (ICU) in a health care facility, collected over
Question:
Mortality data for patients in the intensive care unit (ICU) in a health care facility, collected over 8-hour intervals, are shown in Table 8-34. Since patients have varying risks, the predicted mortality from a logistic regression model that uses the patient’s APACHE score (severity of disease) is also shown. Construct a risk-adjusted chart for the mortality proportion and comment on the ICU performance.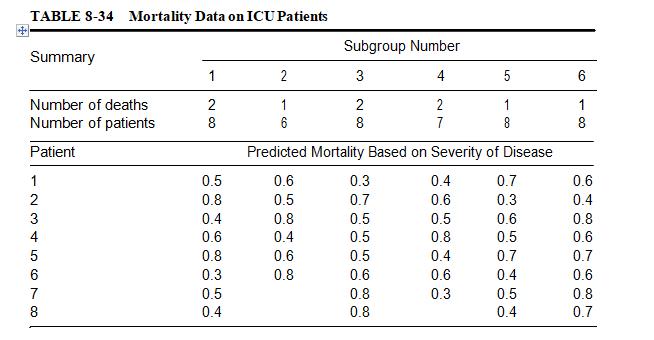
Fantastic news! We've Found the answer you've been seeking!
Step by Step Answer:
A riskadjusted chart is a graphical representation of the mortality proportion or the percentage of ...View the full answer

Answered By
BillClinton Muguai
I have been a tutor for the past 5 years. I have experience working with students in a variety of subject areas, including computer science, math, science, English, and history. I have also worked with students of all ages, from elementary school to college. In addition to my tutoring experience, I have a degree in education from a top university. This has given me a strong foundation in child development and learning theories, which I use to inform my tutoring practices.
I am patient and adaptable, and I work to create a positive and supportive learning environment for my students. I believe that all students have the ability to succeed, and it is my job to help them find and develop their strengths. I am confident in my ability to tutor students and help them achieve their academic goals.
0 Reviews
10+ Question Solved
Related Book For 

Fundamentals Of Quality Control And Improvement
ISBN: 9781118705148
4th Edition
Authors: Amitava Mitra
Question Posted:
