

The figure represents the RHEED oscillation during homoepitaxy of GaAs in an MBE system. (a) At what
Question:
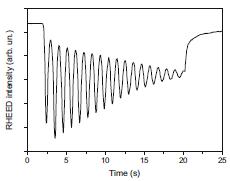
The figure represents the RHEED oscillation during homoepitaxy of GaAs in an MBE system.
(a) At what moment did the growth start and stop?
(b) What is the total thickness of GaAs material deposited?
(c) Give an estimation of the growth rate, in monolayer per second and in micrometer per hour.
Fantastic news! We've Found the answer you've been seeking!
Step by Step Answer:

Answered By
Elias Gichuru
am devoted to my work and dedicated in helping my clients accomplish their goals and objectives,providing the best for all tasks assigned to me as a freelancer,providing high quality work that yields high scores.promise to serve them earnestly and help them achieve their goals.i have the needed expertise,knowledge and experience to handle their tasks.
325+ Reviews
859+ Question Solved
Related Book For 

Question Posted:
