

The phase diagram shown is for mixtures of HCl and H 2 O at a pressure of
Question:
The phase diagram shown is for mixtures of HCl and H2O at a pressure of 1 atm. The red curve represents the normal boiling points of solutions of HCl(aq) of various mole fractions. The blue curve represents the compositions of the vapors in equilibrium with boiling solutions.
(a) As a solution containing xHCl = 0.50 begins to boil, will the vapor have a mole fraction of HCl equal to, less than, or greater than 0.50? Explain.
(b) In the boiling of a pure liquid, there is no change in composition. However, as a solution of HCl(aq)
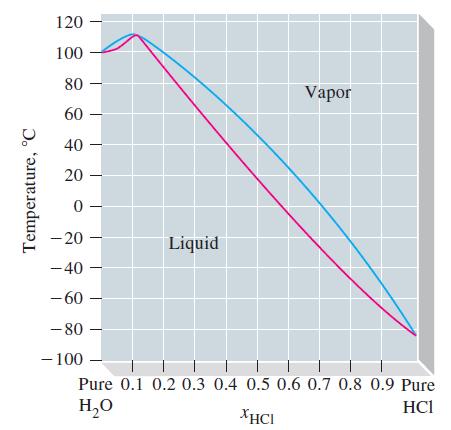
boils in an open container, the composition changes. Explain why this is so.
(c) One particular solution (the azeotrope) is an exception to the observation stated in part (b); that is, its composition remains unchanged during boiling. What are the approximate composition and boiling point of this solution?
(d) A 5.00 mL sample of the azeotrope (d = 1.099 g/mL) requires 30.32 mL of 1.006 M NaOH for its titration in an acid-base reaction. Use these data to determine a more precise value of the composition of the azeotrope, expressed as the mole fraction of HCl.
Step by Step Answer:
a The vapor will have a mole fraction of HCl greater than 050 This is because HCl is more volatile t...View the full answer


General Chemistry Principles And Modern Applications
ISBN: 9780132931281
11th Edition
Authors: Ralph Petrucci, Jeffry Madura, F. Herring, Carey Bissonnette
