

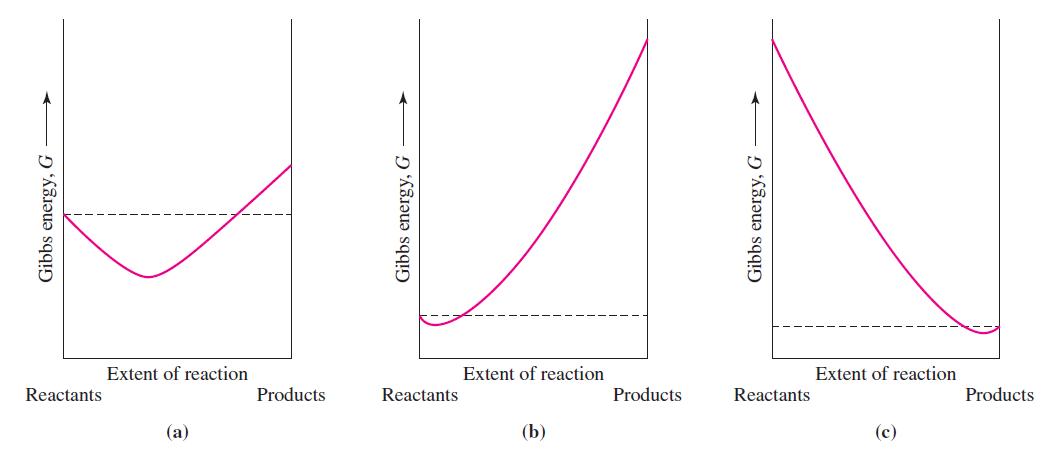
Which of the following graphs of Gibbs energy versus the extent of reaction represents an equilibrium constant
Question:
Which of the following graphs of Gibbs energy versus the extent of reaction represents an equilibrium constant closest to 1?
Fantastic news! We've Found the answer you've been seeking!
Step by Step Answer:

Answered By
Muqadas Javed
I am a mentor by profession since seven years. I have been teaching on online forums and in universities. Teaching is my passion therefore i always try to find simple solution for complicated problems or task grasp them so that students can easily grasp them.I will provide you very detailed and self explanatory answers and that will help you to get good grade. I have two slogans: quality solution and on time delivery.
24+ Reviews
144+ Question Solved
Related Book For 
General Chemistry Principles And Modern Applications
ISBN: 9780132931281
11th Edition
Authors: Ralph Petrucci, Jeffry Madura, F. Herring, Carey Bissonnette
Question Posted:
