Table 4.4 shows results from the study of diabetic patients discussed in Goldman and Smith (2002). Recall
Question:
Table 4.4 shows results from the study of diabetic patients discussed in Goldman and Smith (2002). Recall that three groups of patients separated by education level were treated with one of two therapies (conventional vs. intensive). Their average hemoglobin A1c levels (also known as glycosylated hemoglobin) before and after the experiment are reported. Note that, as in golf, lower scores are better on the hemoglobin A1c test, which measures how well the patient has kept blood glucose levels in control. Most treatment regimens for diabetes are designed to keep hemoglobin A1c levels low.
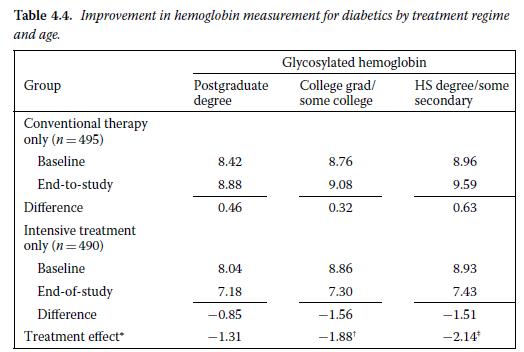
As the figure indicates, average hemoglobin A1c levels deteriorated for patients in the control group, but improved for patients in the treatment group.
a. In all three groups of conventional-therapy patients, glucose levels got worse.
Which of the conventional therapy groups had the biggest deterioration in average glycosylated hemoglobin levels?
b. Which intensive-treatment group had the biggest improvement in average glycosylated hemoglobin levels?
c. For which group of patients did the intensive-treatment intervention seem to have the biggest effect compared with the conventional therapy? The smallest effect?
d. Explain how this evidence is consistent with the efficient producer hypothesis.
Step by Step Answer:
a To determine which of the conventional therapy groups had the biggest deterioration in average gly...View the full answer