

The bar graph shows the win-loss record for a lacrosse team over a period of three...
Question:
The bar graph shows the win-loss record for a lacrosse team over a period of three years.
\n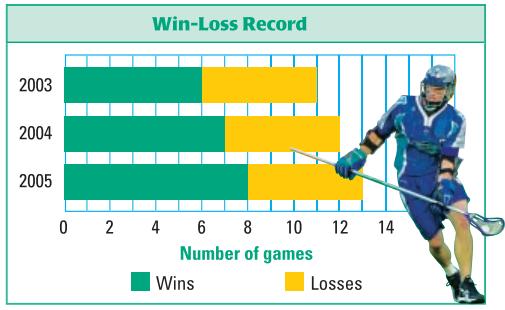
a. Use the scale to find the length of the yellow bar for each year. What does the length represent?
\nb. For each year, find the percent of games lost by the team.
\nc. Explain how you are applying the Segment Addition Postulate when you find information from a stacked bar graph like the one shown.
\n
Fantastic news! We've Found the answer you've been seeking!
Step by Step Answer:
Lets analyze the provided bar graph for the lacrosse teams winloss record over three years a The yel...View the full answer

Answered By
William Otieno
I am a professional tutor and a writer with excellent skills that are important in serving the bloggers and other specialties that requires a great writer. The important aspects of being the best are that I have served so many clients with excellence
With excellent skills, I have acquired very many recommendations which have made it possible for me to survive as an excellent and cherished writer. Being an excellent content writer am also a reputable IT writer with essential skills that can make one turn papers into excellent result.
83+ Reviews
354+ Question Solved
Related Book For 
Holt McDougal Larson Geometry
ISBN: 9780547315171
1st Edition
Authors: Ron Larson, Laurie Boswell, Timothy D. Kanold, Lee Stiff
Question Posted:
