

Figure 26.68 shows Mssbauer spectra of a sample of ferredoxin from chloroplasts at 77 K. Interpret the
Question:
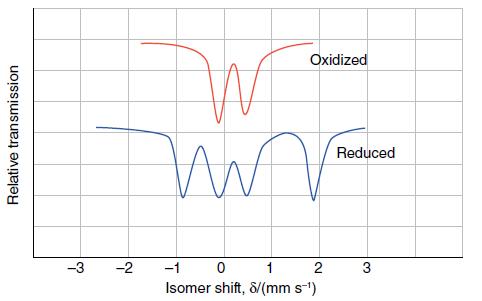
Figure 26.68 shows Mössbauer spectra of a sample of ferredoxin from chloroplasts at 77 K. Interpret the data with regard to the oxidation states an spin states of the two Fe atoms and comment on the electron delocalization at this temperature.
Figure 26.68.
Fantastic news! We've Found the answer you've been seeking!
Step by Step Answer:
Interpretation of the Mssbauer spectra in Figure 2668 The Mssbauer spectroscopy is a powerful techni...View the full answer

Answered By
Deepak Sharma
0 Reviews
10+ Question Solved
Related Book For 
Inorganic Chemistry
ISBN: 9780198768128
7th Edition
Authors: Mark Weller, Tina Overton, Jonathan Rourke
Question Posted:
