Figure 4.41 shows the single crystal EPR spectrum arising from Cu 2+ doped into CaCd(O 2 CMe)
Question:
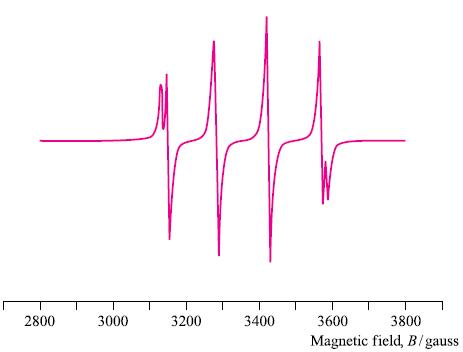
Figure 4.41 shows the single crystal EPR spectrum arising from Cu2+ doped into CaCd(O2CMe)4 · 6H2O for one orientation of the crystal relative to the external magnetic field. The spectrum illustrates the presence of both isotopes of Cu (63Cu and 65Cu, natural abundances 69.15% and 30.85%, respectively, both I = 3/2).
(a) How many peaks do you expect to observe for each isotope?
(b) Explain why the intensities of the central peaks in Fig. 4.41 are higher than those of the outer peaks.
(c) The hyperfine coupling constant A(65Cu) is 1.07 times higher than A(63Cu). Which signals in Fig. 4.41 arise from each isotope? Calculate the value of A (in G) for each isotope.
(d) The EPR spectrum in Fig. 4.41 was measured as 9.75GHz. Calculate the gyromagnetic factor of the copper(II) paramagnetic species.
Figure 4.41
Step by Step Answer:
a For each isotope of Cu 63Cu and 65Cu the number of peaks expected in the EPR spectrum is given by 2I 1 where I is the nuclear spin quantum number In ...View the full answer