

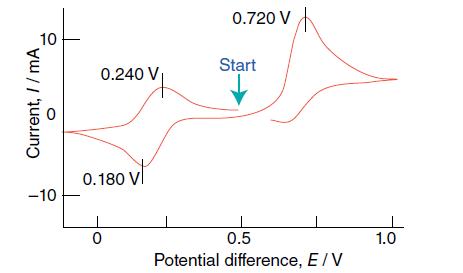
Interpret the cyclic voltammogram shown in Fig. 8.58, which has been recorded for an Fe(III) complex in
Question:
Interpret the cyclic voltammogram shown in Fig. 8.58, which has been recorded for an Fe(III) complex in aqueous solution.
Figure 8.58.
Fantastic news! We've Found the answer you've been seeking!
Step by Step Answer:
The cyclic voltammogram shown in Fig 858 represents the electrochemical behavior of an FeIII complex in an aqueous solution as a function of potential ...View the full answer

Answered By
User l_998468
I have extensive tutoring experience, having worked as a private tutor for over three years. I have tutored students from different academic levels, including high school, undergraduate, and graduate levels. My tutoring experience has taught me to be patient, attentive to student needs, and effective in communicating difficult concepts in simple terms.
I have a strong background in statistics, probability theory, data analysis, and data visualization. I am proficient in using statistical software such as R, Python, and SPSS, which are commonly used in academic research and data analysis. Additionally, I have excellent communication and interpersonal skills, which enable me to establish rapport with students, understand their learning styles, and adapt my teaching approach to meet their needs.
I am passionate about teaching and helping students achieve their academic goals.
0 Reviews
10+ Question Solved
Related Book For 

Inorganic Chemistry
ISBN: 9780198768128
7th Edition
Authors: Mark Weller, Tina Overton, Jonathan Rourke
Question Posted:
