

Here are data on Japanese exports and imports, for 2012, for the same seven products shown for
Question:
Here are data on Japanese exports and imports, for 2012, for the same seven products shown for U.S. trade in Figure 6.2:
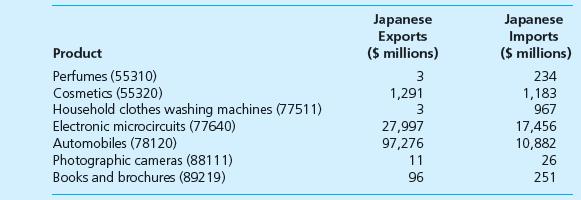
a. For each product for Japan, calculate the IIT share.
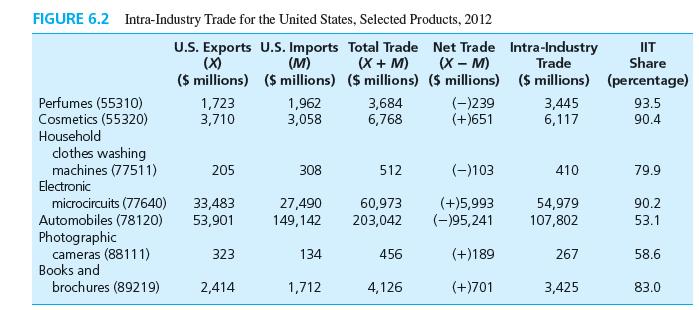
b. The weighted average of IIT shares for these seven products for 2012 for the United States (using the data from Figure 6.2) is 63.1 percent. For Japan for these seven products for 2012, what is the weighted average of the IIT shares? Which country has relatively more IIT in these seven products?
Data From Figure 6.2
Fantastic news! We've Found the answer you've been seeking!
Step by Step Answer:
a Here is the calculation for perfumes IIT share 1 3 2343 234 0025 or 25 Using the same typ...View the full answer

Answered By
Susan Juma
I'm available and reachable 24/7. I have high experience in helping students with their assignments, proposals, and dissertations. Most importantly, I'm a professional accountant and I can handle all kinds of accounting and finance problems.
15+ Reviews
45+ Question Solved
Related Book For 

Question Posted:
