In this problem you will use the World Development Indicators (WDI) database from the World Bank to
Question:
In this problem you will use the World Development Indicators (WDI) database from the World Bank to compute the comparative advantage of two countries in the major sectors of gross domestic product (GDP): agriculture, industry (which includes manufacturing, mining, construction, electricity, and gas), and services. Go to the WDI website at http://wdi.worldbank.org/tables, where you will be choosing the sections on “People” and on the “Economy.”
a. In the “People” section, start by choosing “Labor force structure.” Choose two countries that you would like to compare, and for a recent year write down their total labor force (in millions) and the percentage of the labor force that is female. Then calculate the number of the labor force (in millions) who are male and the number who are female.
b. Again using the “People” section of the WDI, go to the “Employment by sector” table. For the same two countries that you chose in part (a) and for roughly the same year, write down the percent of male employment and the percent of female employment in each of the three sectors of GDP: agriculture, industry, and services. (If the data are missing in this table for the countries that you chose in part (a), use different countries.)
Use these percentages along with your answer to part (a) to calculate the number of male workers and the number of female workers in each sector. Add together the number of male and female workers to get the total labor force in each sector.
c. In the “Economy” section, go to the table “Structure of output.” There you will find GDP (in $ billions) and the % of GDP in each of the three sectors: agriculture, industry, and services. For the same two countries and the same year that you chose in part (a), write down their GDP (in $ billions) and the percentage of their GDP accounted for by agriculture, by industry, and by services. Multiply GDP by the percentages to obtain the dollar amount of GDP coming from each of these sectors, which is interpreted as the value-added in each sector, that is, the dollar amount that is sold in each sector minus the cost of materials (not including the cost of labor or capital) used in production.
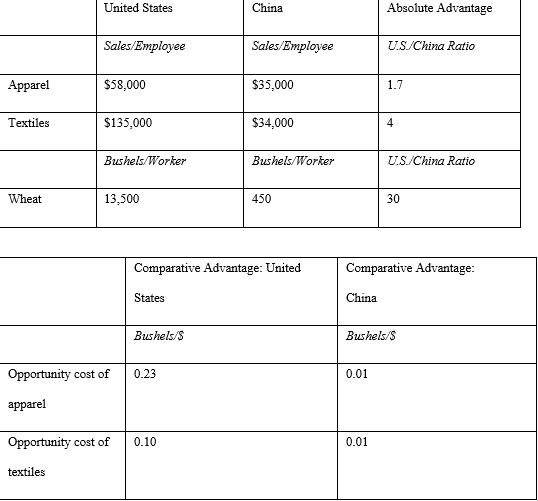
d. Using your results from parts (b) and (c), divide the GDP from each sector by the labor force in each sector to obtain the value-added per worker in each sector. Arrange these numbers in the same way as the “Sales/Employee” and “Bushels/Worker” shown in Table 2-2. Then compute the absolute advantage of one country relative to the other in each sector, as shown on the right-hand side of Table 2-2. Interpret your results. Also compute the comparative advantage of agriculture/industry and agriculture/services (in the same way as shown at the bottom of Table 2-2) and the comparative advantage of industry/services.Based on your results, what should be the trade pattern of these two countries if they were trading only with each other?
Step by Step Answer:
a b c d Thailand has a comparative advantage in both Service and Industry Suppose that a farmer s...View the full answer