The United States has had a trade deficit every year since 1980. Why does the United States
Question:
The United States has had a trade deficit every year since 1980. Why does the United States have this trade deficit? Why did it become very large in the mid-1980s and again starting in the late 1990s?
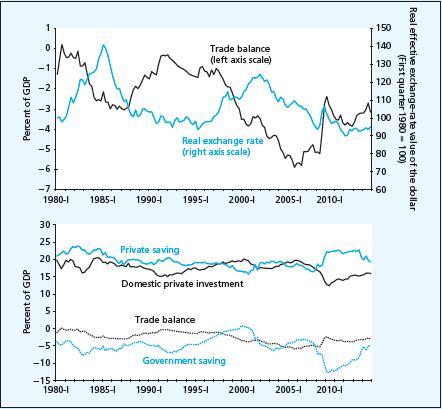
The United States has a floating exchange rate, so one place to look for an explanation is in changes in the real exchange-rate value of the U.S. dollar (recall our discussion of the real exchange rate in Chapter 19). The top graph in the accompanying figure shows the value of the real effective exchange-rate value of the dollar, as an indicator of the international price competitiveness of U.S. products, and the value of the U.S. trade balance (measured as a percentage of U.S. GDP, to make the size more comparable over time). It is clear that we may have a pretty good explanation here, if we allow for the lag of one to two years (recall the J curve from Chapter 23).
That is, the dollar begins a large real appreciation in 1980 and the trade balance begins to deteriorate in 1982. The value of the dollar peaks in 1985 and begins a real depreciation that returns the real value in 1988 back to what it was in 1980.
The trade balance begins to improve in 1987.
The next big swing begins when the dollar starts another real appreciation in 1995. The trade balance deteriorates beginning in 1997. Then the dollar begins a real depreciation in 2002. This time the lag is somewhat longer—the trade balance begins to improve in 2006.
So an explanation of the large U.S. trade deficits is the change in international price competitiveness caused by exchange-rate swings. When the dollar experiences a real appreciation, the loss of price competitiveness hurts U.S. exports and encourages U.S. imports, so the trade balance deteriorates. The problem with this explanation is that it is not very deep. With a floating rate, the exchange-rate value of the U.S. dollar is an endogenous variable. We should probe further to find out what is behind the broad swings in the exchange rate and the trade balance.
One place to look is in the relationships between national saving and investment that we introduced in Chapter 16 and used again in Chapter 22.
The bottom graph in the accompanying figure shows two aspects of national saving, private saving by households and businesses and government saving, which is the government budget surplus or deficit. If the government runs a surplus, then it is collecting more in tax revenues than it is spending, so the difference is a form of saving. If the government runs a deficit, then it is dissaving. The graph also shows domestic private investment and the trade balance again.
In the 1980s the closest relationship is between the government budget and the trade balance.
In 1981 the Reagan administration obtained a major tax cut while government expenditures continued to grow. The government budget deficit increased to about 7.7 percent of GDP in late 1982 and remained at about 6 percent of GDP until 1987. In the graph the increase in the government budget deficit is shown as a decline in government saving in the early 1980s, with the line then remaining at about 26 percent for several years. Essentially, both the government budget deficit and the trade deficit increased in the first half of the 1980s and declined in the late 1980s. They came to be called the twin deficits.
Our model provides some insights into this relationship. Expansionary fiscal policy shifted the IS curve to the right, increasing both U.S. interest rates and U.S. national income. The rise in income alone tended to increase the trade deficit. The relatively high U.S. interest rates also drew large capital inflows and the real exchange-rate value of the dollar increased (as we saw in the top graph). In 1985 the capital inflows declined, so the large trade deficit became an important driver of the exchange-rate value of the dollar. The dollar began to depreciate in early 1985.
The explanation for the rise of the trade deficit in the second half of the 1990s is different.
The government budget is not the explanation because the deficit began to decline in 1992.
Instead, the explanation of the rising U.S. trade deficit in the late 1990s is the boom in real domestic investment. In the 1980s both private saving and private investment declined as shares of GDP
In the 1990s private saving continued to decline, but private domestic investment rose strongly, from 15 percent of GDP to about 20 percent.
Businesses perceived major opportunities for profitable capital investments in the United States. So did financial investors, with a booming stock market drawing in large amounts of foreign capital.
In terms of our macromodel, the story is much the same, though the driver is different (real domestic investment in the 1990s, fiscal policy in the 1980s).
The increase in real domestic investment shifts the IS curve to the right. The trade balance deteriorates because of strong growth in U.S. GDP. The capital inflows appreciate the dollar, so the trade balance also deteriorates because of declining price competitiveness.
The stock market and real investment booms ended in 2000. As shown in the bottom graph, the decline in government saving (the rapid increase in the government budget deficit) again became the key driver of the growing trade deficit during 2000–2004. Then, with the onset of the global financial and economic crisis, the government budget deficit increased; private saving increased as households and businesses strove to reduce their debts; and domestic real investment, including new residential construction, collapsed.
From late 2009 the overall effects of these changes on the trade balance was actually rather small.
DISCUSSION QUESTION In mid-2014 you expected that, during the next several years, private saving would decrease and the government budget deficit would continue to decline. What was your forecast for the trade balance?
Step by Step Answer:
First if US private saving decreases then the United States will need additional financial capital i...View the full answer