There is tremendous social importance to international comparisons of income or production levels. To judge which countries
Question:
There is tremendous social importance to international comparisons of income or production levels. To judge which countries are most in need of United Nations aid, World Bank loans, and other help, officials compare their incomes per capita. To judge whether South Korea has overtaken Japan in supply prowess, we compare Korean and Japanese gross domestic product per capita. All such comparisons are dangerous as well as unavoidable. The comparisons are likely to contain a host of errors.
One of the worst pitfalls comes in converting from one national currency to another. It turns out that the market exchange rate is a poor way to convert because the purchasing power parity hypothesis is not reliable when applied to all the goods and services that make up national expenditure or domestic production. Many of the products in such a broad bundle are not traded internationally. There is no direct reason
(like arbitrage) to think that the prices of nontraded products should equalize internationally when stated in a common currency using market exchange rates, and they usually do not.
If the market exchange rate is unreliable, what should we use for comparing values of income per capita between countries? The principle is clear: We want to take the national income per capita measured using whatever prices exist in each country and convert these into values of national incomes per capita using a set of common international prices like those that would exist if PPP applied. That way, we are comparing how many units of a consistently priced bundle of goods and services the average resident of each nation could buy. But it is difficult to get data on the prices of a wideranging bundle of goods and services for every country.
That is where the United Nations International Comparisons Project (ICP) came in. Teams of researchers have done the hard work of measuring the prices of items in separate countries. What they have found, in effect, are the true levels of P and Pf for deflating the current-price national income figures. They confirm what was widely feared: On average for all goods and services, the market exchange rate e is often far from the ratio P/Pf that absolute PPP says it would equal.
The accompanying table shows the typical pattern in departures from absolute PPP and the importance of replacing exchange-rate conversions of income per capita with the better comparisons based on common price levels.
If purchasing power parity really held, then every number in the right-hand column would be 100.
The departures from that PPP norm are great enough to reshuffle some of the international rankings, making the better (PPP-based) measurements of the center column differ from the exchange-rate-based measures on the left. Two patterns are apparent in the figures. One is that the price-difference ratio in the right-hand column is above unity for most industrialized countries.
Their PPP-measured real average income is not as high relative to that of the United States as the exchange-rate figures imply.
Another pattern is that the usual comparisons—
the ones using exchange rates—overstate the real income gaps between rich and poor nations because the price-difference ratio is below unity for the lower-income countries in the bottom half of the list. For some of the poorest countries, the price disparity can be as large as 1:4, a substantial deviation from absolute PPP.
Why do lower-income countries have prices so much lower than U.S. prices? Most of the departures come from the wide international gaps in the prices of nontraded products like housing, haircuts, and other local services. The prices of nontraded products differ radically between lower-income and higher-income countries. The gaps in the prices of these products seem to be widened by two forces. One is the tendency for the price of land in towns and cities to be highly sensitive to the income of the country’s residents. So a country with twice as high an income would have more than twice as high a cost for business and residential space, making space-intensive nontraded products cost much more. A second explanation is that, as a country develops, its productivity in making traded goods rises much faster than its productivity in making nontraded goods and services. The higher productivity in making traded goods tends to 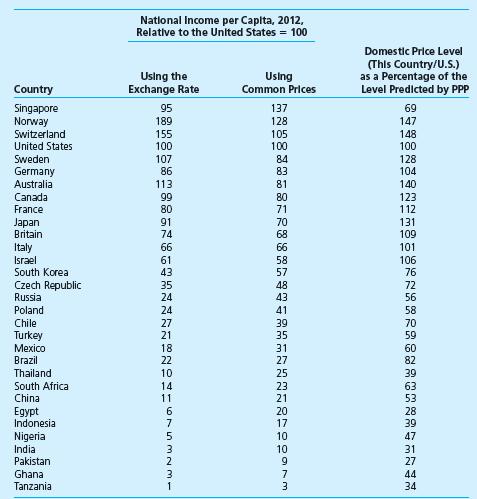
increase wage rates in more developed countries.
Firms making nontraded goods and services must also pay these higher wage rates. With less productivity advantage, this results in costs and prices of nontraded products that are higher in moredeveloped countries.
DISCUSSION QUESTION The table reports that Singapore’s national income per capita was a little less than that of the United States, when compared using the market exchange rate for the Singapore dollar. Why is Singapore at the top of the list?
Step by Step Answer:
The list of countries is ordered by national income per capita using common prices sometimes called ...View the full answer