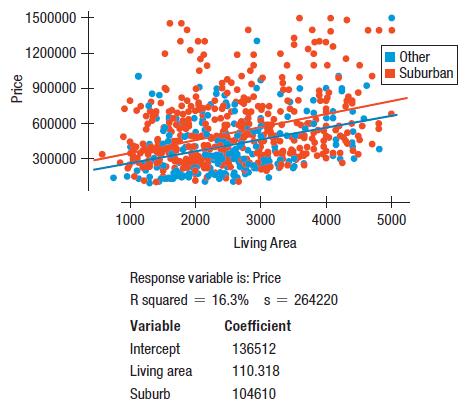
As a class project, students in a large statistics class collected publicly available information on recent home
Question:
As a class project, students in a large statistics class collected publicly available information on recent home sales in their hometowns. There are 894 properties. Among the variables available is an indication of whether the home was in an urban, suburban, or rural setting. Here is a scatterplot relating the selling Price of homes to their Living area (sq ft), colored according to whether or not they were in a suburban setting.

a) What is an appropriate interpretation of the coefficient of Living area?
b) What is an appropriate interpretation of the coefficient of Suburb?
c) Is it appropriate to use a variable such as Suburb in this model?
Step by Step Answer:

Intro Stats
ISBN: 9780134668420
5th Edition
Authors: Richard D De Veaux, Paul F Velleman, David E Bock, Nick Horton


