

As part of the course work, a class at an upstate NY college collects data on streams
Question:
As part of the course work, a class at an upstate NY college collects data on streams each year. Students record a number of biological, chemical, and physical variables, including the stream name, the substrate of the stream (limestone (L), shale (S), or mixed (M)), the pH, the temperature (°C), and the BCI, a measure of biological diversity.
a) Name each variable, indicating whether it is categorical or quantitative, and give the units if available.
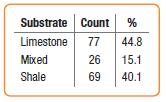
b) These streams have been classified according to their substrate—the composition of soil and rock over which they flow—as summarized in the table. What kind of graph might be used to display these data?
Step by Step Answer:
a Stream Name categorical Substrate categ...View the full answer


Intro Stats
ISBN: 9780134668420
5th Edition
Authors: Richard D De Veaux, Paul F Velleman, David E Bock, Nick Horton
