

For the car speed data in Exercise 30, here are the histogram, boxplot, and Normal probability plot
Question:
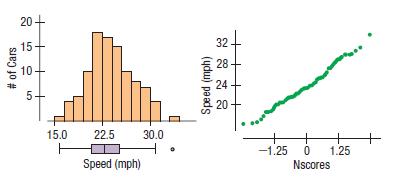
For the car speed data in Exercise 30, here are the histogram, boxplot, and Normal probability plot of the 100 readings. Do you think it is appropriate to apply a Normal model here? Explain.
Data From Exercise 30
John Beale of Stanford, California, recorded the speeds of cars driving past his house, where the speed limit read 20 mph. The mean of 100 readings was 23.84 mph, with a standard deviation of 3.56 mph. (He actually recorded every car for a two-month period. These are 100 representative readings.)
a) How many standard deviations from the mean would a car going under the speed limit be?
b) Which would be more unusual, a car traveling 34 mph or one going 10 mph?
Step by Step Answer:
Thorough and long solution From the histogram boxplot and Normal probability plot of the 100 read...View the full answer


Intro Stats
ISBN: 9780134668420
5th Edition
Authors: Richard D De Veaux, Paul F Velleman, David E Bock, Nick Horton
