

In Chapter 6, Exercise 45 looked at the relationship between the number of runs scored by American
Question:
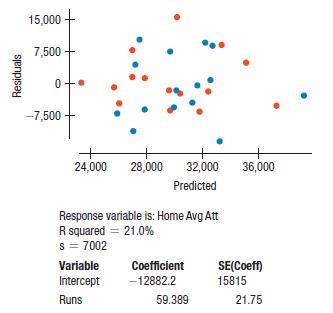
In Chapter 6, Exercise 45 looked at the relationship between the number of runs scored by American League baseball teams and the average attendance at their home games for the 2016 season. Here are the scatterplot, the residuals plot, and part of the regression analysis for all major league teams in 2016 (National League teams in red, American League in blue):
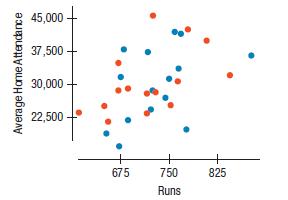
a) Do you think a linear model is appropriate here?
b) Interpret the meaning of R2 in this context.
c) Do the residuals show any pattern worth remarking on?
d) The point at the top of the plots is the L.A. Dodgers. What can you say about the residual for the Dodgers?
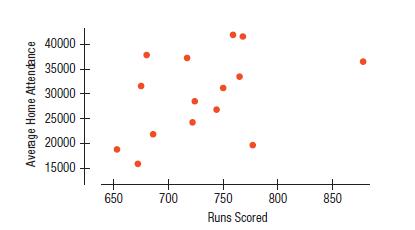
Data From Chapter 6 Exercise 45
American League baseball games are played under the designated hitter rule, meaning that pitchers, often weak hitters, do not come to bat. Baseball owners believe that the designated hitter rule means more runs scored, which in turn means higher attendance. Is there evidence that more fans attend games if the teams score more runs? Data collected from American League games during the 2016 season indicate a correlation of 0.432 between runs scored and the average number of people at the home games. (www.espn.com/mlb/attendance)
Step by Step Answer:
a The linear model is appropriate Although the relationship is not strong it is reasonably str...View the full answer


Intro Stats
ISBN: 9780134668420
5th Edition
Authors: Richard D De Veaux, Paul F Velleman, David E Bock, Nick Horton
