

The mean price of pizza in Baltimore was $2.85, $0.23 higher than the mean price of $2.62
Question:
The mean price of pizza in Baltimore was $2.85, $0.23 higher than the mean price of $2.62 in Dallas. To see if that difference was real, or due to chance, we took the 156 prices from Baltimore and Dallas and mixed those 312 prices together. Then we randomly chose 2 groups of 156 prices 10,000 times, and computed the difference in the mean price each time. The histogram shows the distribution of those 10,000 differences.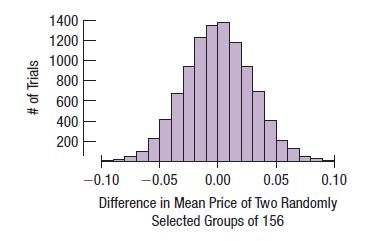
a) Given this histogram, what do you conclude about the actual difference of $0.23 between the mean prices of Baltimore and Dallas?
b) Do you think the presence of the outliers in the boxplots of Exercise 13 affects your conclusion?
c) Perform a similar analysis using shuffling to compare prices in Chicago and Denver. Is the actual difference in mean prices different from what you might expect by chance? Use any software you choose. Both StatCrunch and the apps at astools.datadesk.com can handle this.
Step by Step Answer:
a Baltimore pizza slices cost an average of 023 more which appears to be a re...View the full answer


Intro Stats
ISBN: 9780134668420
5th Edition
Authors: Richard D De Veaux, Paul F Velleman, David E Bock, Nick Horton
