

The survey of 299 undergraduate students from Exercise 86 in Chapter 2 (data in Student Survey) asked
Question:
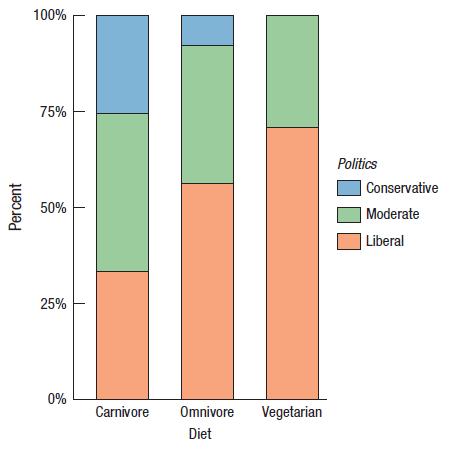
The survey of 299 undergraduate students from Exercise 86 in Chapter 2 (data in Student Survey) asked about respondents’ diet preference (Carnivore, Omnivore, Vegetarian) and political alignment (Liberal, Moderate, Conservative). Here is a stacked bar chart of the 285 responses:
a) Describe what this plot shows using the concept of a conditional distribution.
b) Do you think the differences here are real? Explain.
Fantastic news! We've Found the answer you've been seeking!
Step by Step Answer:
a The distribution of political alignment among carnivores is about 25 conservative 40 mod...View the full answer

Answered By
Fahmin Arakkal
Tutoring and Contributing expert question and answers to teachers and students.
Primarily oversees the Heat and Mass Transfer contents presented on websites and blogs.
Responsible for Creating, Editing, Updating all contents related Chemical Engineering in
latex language
8+ Reviews
22+ Question Solved
Related Book For 

Intro Stats
ISBN: 9780134668420
5th Edition
Authors: Richard D De Veaux, Paul F Velleman, David E Bock, Nick Horton
Question Posted:
