

We have seen data on ballpark attendance in Chapters 6, 7, and 9. Now we find that
Question:
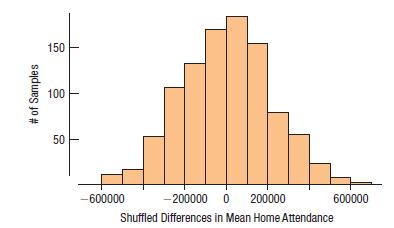
We have seen data on ballpark attendance in Chapters 6, 7, and 9. Now we find that National League teams drew in, on average, nearly 60,000 more fans per season than American League teams. That translates to over $1,000,000 a year. To see whether that difference is statistically significant:
a) Make a boxplot of the Home Attendance by League.
b) Look at this histogram of 1000 differences in means of Home Attendance by League obtained by shuffling the League label among the 30 teams. What does it say about whether 60,000 is a statistically significant difference?
Fantastic news! We've Found the answer you've been seeking!
Step by Step Answer:
a Boxplots of Home Attendance by League are at the right b A difference of 600...View the full answer

Answered By
Qurat Ul Ain
Successful writing is about matching great style with top content. As an experienced freelance writer specialising in article writing and ghostwriting, I can provide you with that perfect combination, adapted to suit your needs.
I have written articles on subjects including history, management, and finance. Much of my work is ghost-writing, so I am used to adapting to someone else's preferred style and tone. I have post-graduate qualifications in history, teaching, and social science, as well as a management diploma, and so am well equipped to research and write in these areas.
265+ Reviews
421+ Question Solved
Related Book For 

Intro Stats
ISBN: 9780134668420
5th Edition
Authors: Richard D De Veaux, Paul F Velleman, David E Bock, Nick Horton
Question Posted:
