

The frequency-response curve shown in Figure SP12.25 is for the primary resonance of a SDOF system with
Question:
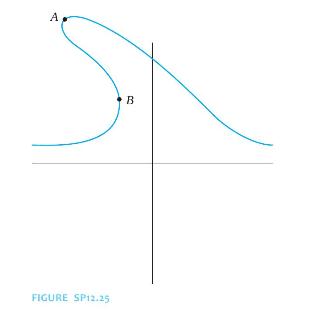
The frequency-response curve shown in Figure SP12.25 is for the primary resonance of a SDOF system with a cubic nonlinearity.
(a) Is the curve drawn for a hardening spring or a softening spring?
(b) Explain the significance of points \(A\) and \(B\) on the diagram.
Fantastic news! We've Found the answer you've been seeking!
Step by Step Answer:

Answered By
Ann Davis
I have worked with the biggest financial firms in the world. I am passionate about helping students understand finance concepts. I have a good understanding of corporate finance concepts. I believe in consistently providing quality solutions. I always go the extra mile whatever I undertake. I never give up on anything I have set my mind to. My ability to learn and execute has helped me undertake some challenging roles in my work assignments. I am confident that my experience would definitely contribute positively to any assignment in the field of corporate finance.
0 Reviews
10+ Question Solved
Related Book For 

Question Posted:
