

Refer to P3.2. The following is the output of a regression analysis applied to these data. Required:
Question:
Refer to P3.2. The following is the output of a regression analysis applied to these data.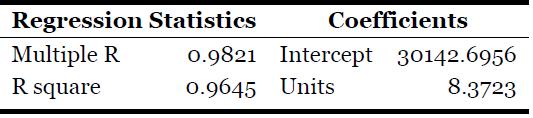
Required:
A. What is the dependent variable in the regression application?B. What is the independent variable in the regression application?C. Using the results, determine the cost equation.D. Estimate the total cost if 11,000 units are made during July.E. Is this regression analysis reliable? Why?
Data from P3.2
Forster is estimating costs for the last half of the year based on activity during the first half of the year. The results from January through June are as follows: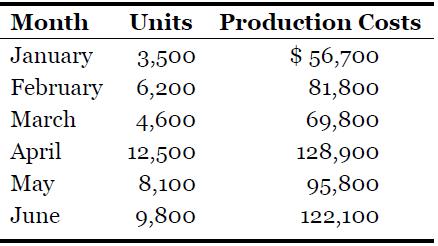
Fantastic news! We've Found the answer you've been seeking!
Step by Step Answer:
A The dependent variable in the regression application is the Production Costs B The indep...View the full answer

Answered By
Akash M Rathod
I have been utilized by educators and students alike to provide individualized assistance with everything from grammar and vocabulary to complex problem-solving in various academic subjects. I can provide explanations, examples, and practice exercises tailored to each student's individual needs, helping them to grasp difficult concepts and improve their skills.
My tutoring sessions are interactive and engaging, utilizing a variety of tools and resources to keep learners motivated and focused. Whether a student needs help with homework, test preparation, or simply wants to improve their skills in a particular subject area, I am equipped to provide the support and guidance they need to succeed.
0 Reviews
10+ Question Solved
Related Book For 

Introduction To AccountingAn Integrated Approach
ISBN: 9781119600107
8th Edition
Authors: Penne Ainsworth, Dan Deines
Question Posted:
