

An experiment was designed to compare several different types of air pollution monitors. Each monitor was set
Question:
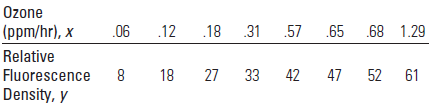
a. Plot the data. What model would you expect to provide the best fit to the data? Write the equation of that model.
b. Use a computer software package to fit the model from part a.
c. Find the least-squares regression line relating the monitor€™s response to the ozone concentration.
d. Does the model contribute significant information for the prediction of the monitor€™s response based on ozone exposure? Use the appropriate p-value to make your decision.
e. Find R2 on the printout. What does this value tell you about the effectiveness of the multiple regression analysis?
Fantastic news! We've Found the answer you've been seeking!
Step by Step Answer:
a The plot is shown below The pattern of the points suggests ...View the full answer

Answered By
Muhammad Umair
I have done job as Embedded System Engineer for just four months but after it i have decided to open my own lab and to work on projects that i can launch my own product in market. I work on different softwares like Proteus, Mikroc to program Embedded Systems. My basic work is on Embedded Systems. I have skills in Autocad, Proteus, C++, C programming and i love to share these skills to other to enhance my knowledge too.
1+ Reviews
10+ Question Solved
Related Book For 

Introduction To Probability And Statistics
ISBN: 9780495389538
13th Edition
Authors: William Mendenhall, Robert J. Beaver, Barbara M. Beaver
Question Posted:
