

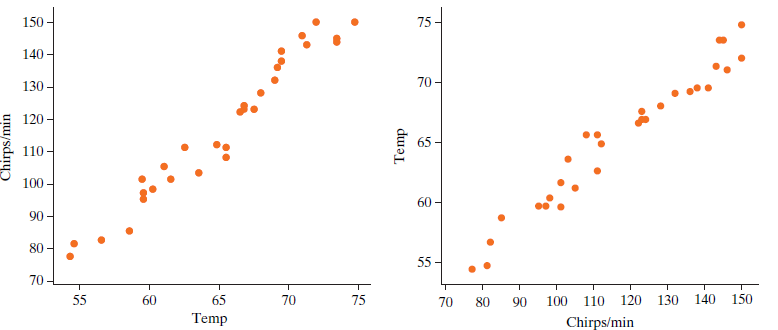
Consider the following two scatterplots based on data gathered in a study of 30 crickets, with temperature
Question:
a. If the goal is to predict temperature based on a cricket€™s chirps per minute, which is the appropriate scatterplot to examine€”the one on the left or the one on the right? Explain briefly.
One of the following is the correct equation of the least squares line for predicting temperature from chirps per minute:
A. predicted temperature = 35.78 + 0.25 chirps per minute
B. predicted temperature = ˆ’131.23 + 3.81 chirps per minute
C. predicted temperature = 83.54 ˆ’ 0.25 chirps per minute
b. Which is the correct equation? Circle your answer and explain briefly.
c. Use the correct equation to predict the temperature when the cricket is chirping at 100 chirps per minute.
d. Interpret the value of the slope coefficient, in this context, for whichever equation you think is the correct one.
Fantastic news! We've Found the answer you've been seeking!
Step by Step Answer:
a Right chirps per minute is on the xaxis which is the e...View the full answer

Answered By
Muhammad Umair
I have done job as Embedded System Engineer for just four months but after it i have decided to open my own lab and to work on projects that i can launch my own product in market. I work on different softwares like Proteus, Mikroc to program Embedded Systems. My basic work is on Embedded Systems. I have skills in Autocad, Proteus, C++, C programming and i love to share these skills to other to enhance my knowledge too.
1+ Reviews
10+ Question Solved
Related Book For 

Introduction To Statistical Investigations
ISBN: 9781118172148
1st Edition
Authors: Beth L.Chance, George W.Cobb, Allan J.Rossman Nathan Tintle, Todd Swanson Soma Roy
Question Posted:
