

In a January 2014 Quinnipiac University poll the following question was asked to a random sample of
Question:
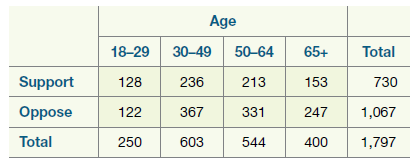
a. What proportion in each age category supports the health care law?
b. Which age category is most supportive of the health care law? Which age category is the least supportive?
c. Write out the null and alternative hypotheses for this study.
d. The table for these results can be found in the file HealthcareAge. Put that table in the Multiple Proportions applet (make sure you click on Use Table). What is the value of the MAD statistic?
e. Do at least 1,000 repetitions and fi nd a p-value.
f. Based on your p-value, how much evidence is there against the null hypothesis?
g. Comment on the ability to generalize and draw cause and- effect conclusions from these data.
Step by Step Answer:
a 1829 128250 0512 3049 236603 0391 5064 213544 0392 65 153400 0383 b 1829 ...View the full answer


Introduction To Statistical Investigations
ISBN: 9781118172148
1st Edition
Authors: Beth L.Chance, George W.Cobb, Allan J.Rossman Nathan Tintle, Todd Swanson Soma Roy
