

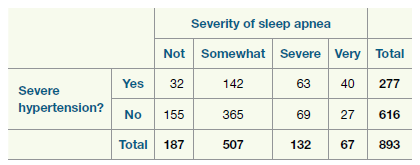
In a study of the relationship between sleep apnea and hypertension (New England Journal of Medicine, 2000),
Question:
a. Is this an experiment or an observational study? How are you deciding?
b. Identify the observational units.
c. Identify the explanatory and response variables. Also, for each variable, identify whether it is categorical or quantitative.
d. Define the parameters of interest. Assign symbols to these parameters.
e. State the appropriate null and alternative hypotheses in symbols.
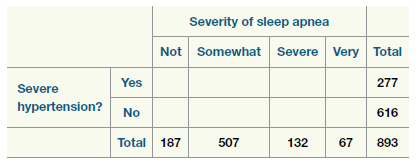
f. Find the table of expected cell counts; that is, complete the table below, assuming the null hypothesis were true.
g. Describe how one might use everyday items (for example, coins, dice, cards, etc.) to conduct a tactile simulation-based test of the hypotheses. Be sure to clearly describe how the p-value will be computed from the simulation.
Step by Step Answer:
a Observational study subjects were not assigned to groups b Each person in the study there ...View the full answer


Introduction To Statistical Investigations
ISBN: 9781118172148
1st Edition
Authors: Beth L.Chance, George W.Cobb, Allan J.Rossman Nathan Tintle, Todd Swanson Soma Roy
