

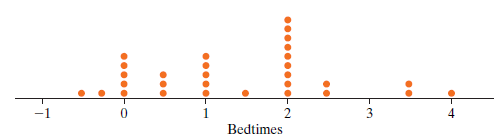
In a survey, 30 college students were asked what their usual bedtime was and the results are
Question:
a. Determine the five-number summary for the bed times.
b. What is the inter-quartile range?
c. The earliest bedtime is 11:30 pm (represented by ˆ’0.50 on the graph). If that person€™s usual bedtime is actually 9:00 pm and that change was made in the dotplot, does that change the inter-quartile range? Would it change the standard deviation?
Fantastic news! We've Found the answer you've been seeking!
Step by Step Answer:
a Min 050 first quartile ...View the full answer

Answered By
Shadrack Mulunga
I am a Biochemistry by profession. However, I have explored different fields of study. My quest to explore new fields has helped me gain new knowledge and skills in Business, clinical psychology, sociology, organizational behavior and general management, and Project Management. I count my expertise in Project management, in particular, creation of Work Break Down Structure (WBS) and use of Microsoft Project software as one of my greatest achievement in Freelancing industry. I have helped thousands of BSC and MSC students to complete their projects on time and cost-effectively using the MS Project tool. Generally, I find happiness in translating my knowledge and expertise to success of my clients. So far, i have helped thousands of students to not only complete their projects in time but also receive high grades in their respective courses. Quality and timely delivery are the two key aspects that define my work. All those who hired my services always come back for my service. If you hire my services today, you will surely return for more. Try me today!
154+ Reviews
289+ Question Solved
Related Book For 

Introduction To Statistical Investigations
ISBN: 9781118172148
1st Edition
Authors: Beth L.Chance, George W.Cobb, Allan J.Rossman Nathan Tintle, Todd Swanson Soma Roy
Question Posted:
