

In the seasons that followed his 2001 record-breaking season, Barry Bonds hit 46, 45, 45, 5, and
Question:
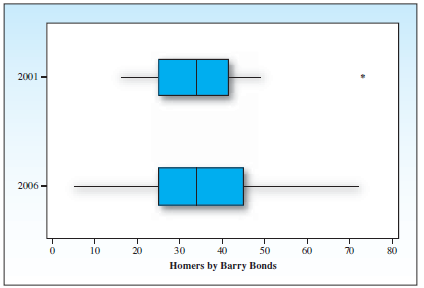
The statistics used to construct these boxplots are given in the table.
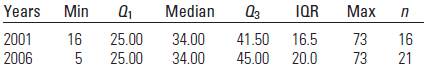
a. Calculate the upper fences for both of these boxplots.
b. Can you explain why the record number of homers is an outlier in the 2001 boxplot, but not in the 2006 boxplot?
Fantastic news! We've Found the answer you've been seeking!
Step by Step Answer:
a Use the information in the exercise For 2001 IQR 165 and the upper ...View the full answer

Answered By
Nyron Beeput
I am an active educator and professional tutor with substantial experience in Biology and General Science. The past two years I have been tutoring online intensively with high school and college students. I have been teaching for four years and this experience has helped me to hone skills such as patience, dedication and flexibility. I work at the pace of my students and ensure that they understand.
My method of using real life examples that my students can relate to has helped them grasp concepts more readily. I also help students learn how to apply their knowledge and they appreciate that very much.
1+ Reviews
10+ Question Solved
Related Book For 
Introduction To Probability And Statistics
ISBN: 9780495389538
13th Edition
Authors: William Mendenhall, Robert J. Beaver, Barbara M. Beaver
Question Posted:
