

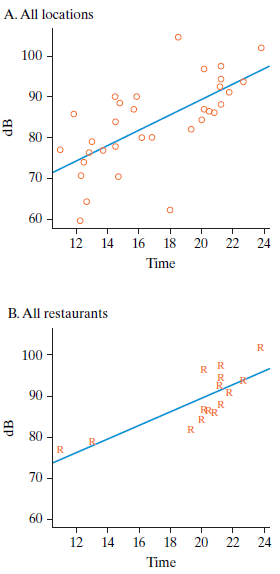
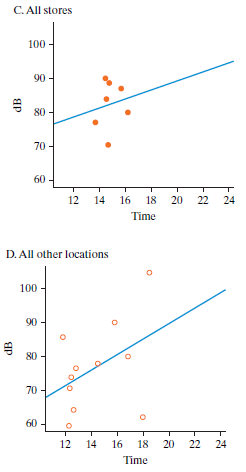
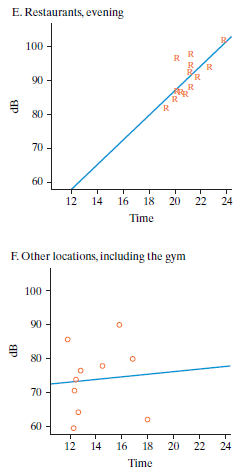
Match each scatterplot with its verbal description (a)(c). You may need to use some descriptions more than
Question:
a. No big outliers, no influential points; strong linear relationship
b. No big outliers, no influential points; not convincing evidence of a linear relationship
c. No big outliers, but two influential points. Removing these points will decrease the correlation and increase the fitted slope.
On July 20, 2012, The New York Times ran an article about the noise level at 33 different locations in New York City. The scatterplots A €“ F below are all based on that study. Each shows noise level in decibels (dB) versus time of day (24-hour clock).
Fantastic news! We've Found the answer you've been seeking!
Step by Step Answer:
a A a...View the full answer

Answered By
ALBANUS MUTUKU
If you are looking for exceptional academic and non-academic work feel free to consider my expertise and you will not regret. I have enough experience working in the freelancing industry hence the unmistakable quality service delivery
178+ Reviews
335+ Question Solved
Related Book For 

Introduction To Statistical Investigations
ISBN: 9781118172148
1st Edition
Authors: Beth L.Chance, George W.Cobb, Allan J.Rossman Nathan Tintle, Todd Swanson Soma Roy
Question Posted:
