

Referring to the previous exercise, two possible data tables are shown in the following table . Which
Question:
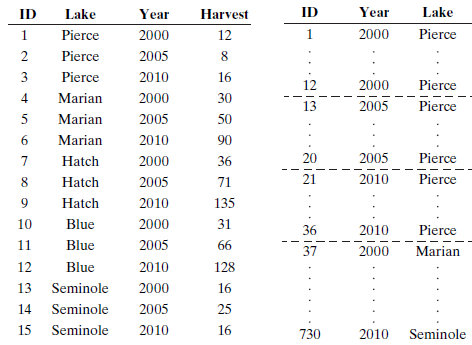
Data from previous exercise
Alligators have become a big concern in Florida. Here are some gator data.
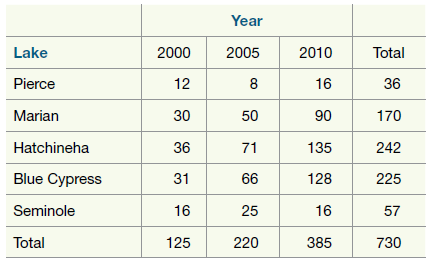
The rows are for five small Florida lakes. They stretch along a line from the west coast near Tampa to the east coast. The columns are for years, spaced half a decade apart. The counts tell the numbers of alligators harvested. (Data source: myfwc. com/mediaˆ™1357388ˆ™Alligator_Annual_Summaries.pdf.) Look first at the column totals: Is there a trend over time? Then look at row totals: How do lakes compare? Finally, think about association. Is the pattern over time pretty much the same for all five lakes?
Fantastic news! We've Found the answer you've been seeking!
Step by Step Answer:
The table on the right has the correct observationa...View the full answer

Answered By
Larlyu mosoti
I am a professional writer willing to do several tasks free from plagiarism, grammatical errors and submit them in time. I love to do academic writing and client satisfaction is my priority. I am skilled in writing formats APA, MLA, Chicago, and Harvard I am a statistics scientist and I can help out in analyzing your data. I am okay with SPSS, EVIEWS, MS excel, and STATA data analyzing tools.
Statistical techniques: I can do linear regression, time series analysis, logistic regression, and some basic statistical calculations like probability distributions. . I'm ready for your working projects!
Services I would offer:
• Academic writing.
• Article writing.
• Data entry.
• PDF conversion.
• Word conversion
• Proofreading.
• Rewriting.
• Data analyzing.
The best reason to hire me:
- Professional and Unique work in writing.
- 100% satisfaction Guaranteed
- within required time Express delivery
- My work is plagiarism Free
- Great communication
My passion is to write vibrantly with dedication. I am loyal and confident to give my support to every client. Because Client satisfaction is much more important to me than the payment amount. A healthy client-contractor relationship benefits in the longer term. Simply inbox me if you want clean work.
3+ Reviews
10+ Question Solved
Related Book For 

Introduction To Statistical Investigations
ISBN: 9781118172148
1st Edition
Authors: Beth L.Chance, George W.Cobb, Allan J.Rossman Nathan Tintle, Todd Swanson Soma Roy
Question Posted:
