

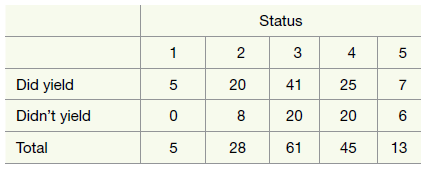
Use the appropriate applet to construct a simulated null distribution using the MAD statistic. Mark the observed
Question:
a. Paste a screenshot or draw your null distribution below with the observed MAD marked and the approximate p-value shaded in.
b. Is the observed statistic out in the tail of this null distribution or is it a fairly typical result?
c. What is the p-value from your simulation? Based on this simulation analysis, would you conclude that the experiment provides strong evidence against the null hypothesis and conclude that there is a genuine difference in at least one of the probabilities of not yielding for the five different status groups? Explain your reasoning.
The following table provides descriptive statistics on the 152 drivers:
The word "distribution" has several meanings in the financial world, most of them pertaining to the payment of assets from a fund, account, or individual security to an investor or beneficiary. Retirement account distributions are among the most...
Step by Step Answer:
a b The observed statistic is somewhat out in the tail of this null dist...View the full answer


Introduction To Statistical Investigations
ISBN: 9781118172148
1st Edition
Authors: Beth L.Chance, George W.Cobb, Allan J.Rossman Nathan Tintle, Todd Swanson Soma Roy
