

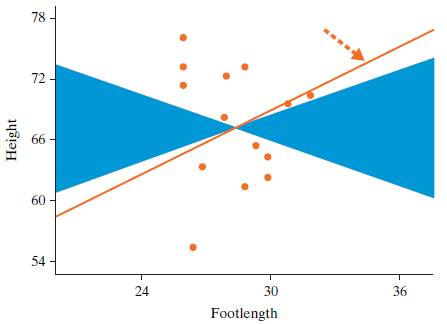
Using foot length and height data, we shuffled the y-values 100 times and each time plotted the
Question:
Fantastic news! We've Found the answer you've been seeking!
Step by Step Answer:
The estimated pvalue from the simulation ...View the full answer

Answered By
Navashree Ghosh
I believe in quality work and customer satisfaction. So, I can assure you that you will get quality work from me when you hire me. Let's work together and build a long-term association.
82+ Reviews
116+ Question Solved
Related Book For 

Introduction To Statistical Investigations
ISBN: 9781118172148
1st Edition
Authors: Beth L.Chance, George W.Cobb, Allan J.Rossman Nathan Tintle, Todd Swanson Soma Roy
Question Posted:
