

Data for hydrogen are given by Dymond and Smith (1969) as, (a) Plot these data versus T
Question:
Data for hydrogen are given by Dymond and Smith (1969) as,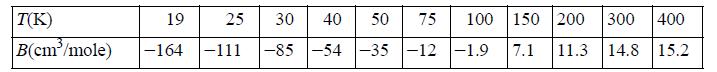
(a) Plot these data versus T-1and compare to the results from the generalized virial equation (Eqn. 7.7). Suggest a reason that this specific compound does not fit the generalized equation very accurately. Use points without lines for the experimental data and lines without points for the theoretical curve.
(b) Use the generalized virial equation to speculate whether a small leak in an H2 line at 300 bar and 298 K might raise the temperature of H2 high enough to cause it to spontaneously ignite.![]()
Step by Step Answer:

This question has not been answered yet.
You can Ask your question!
Related Book For 
Introductory Chemical Engineering Thermodynamics
ISBN: 9780136068549
2nd Edition
Authors: J. Elliott, Carl Lira
Question Posted:
