

The accompanying graph depicts a market for labor. What is the equilibrium wage and equilibrium quantity of
Question:
The accompanying graph depicts a market for labor.
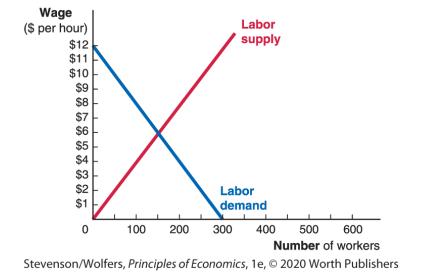
What is the equilibrium wage and equilibrium quantity of workers that will be hired in this particular labor market? Suppose the government imposes a minimum wage in this market at $4 per hour. What would happen in this market as a result of the new minimum wage? Suppose that the government decides to increase the minimum wage to $10 (a $6 increase). What would happen in this market as a result of the increase in the minimum wage?
Fantastic news! We've Found the answer you've been seeking!
Step by Step Answer:
Equilibrium wage and quantity The equilibrium wage is the wage at which the quantity of labor demanded by employers is equal to the quantity of labor supplied by workersThis is shown in the graph below at point Ewhere the wage is 5 per hour and the quantity of workers is 100 Impact of a 4 minimum wage A 4 minimum wage will set a floor on the wage that employers can payThis means that all workers will be paid at least 4 per houreven if the market wage would otherwise be lower The 4 minimum wage will create a surplus of laboras shown in the graph belowThis is because employers will demand fewer workers at the higher wagebut workers will still be willing to supply the same amount of labor The surplus of labor will lead to unemploymentSome workers will be unable to find jobs because employers are not willing to pay them the 4 minimum wage Impact of a 10 minimum wage A 10 minimum wage will create an even larger surplus of laboras shown in the graph belowThis is because employers will demand even fewer workers at the even higher wage The unemployment rate will be higher with a 10 minimum wage than with a 4 minimum wage Conclusion A minimum wage can create a surplus of labor and lead to unemploymentThe higher the minimum wagethe larger the surplus of labor and the higher the unemployment rate Graph The following graph illustrates the impact of a minimum wage The blue curve represents the initial demand curve for laborand the red curve represents the demand curve for labor after the minimum wage is implementedThe equilibrium wage without the minimum wage is 5 per hourand the equilibrium wage with the minimum wage is 4 per hour The 4 minimum wage creates a surplus of laboras shown by the shaded area in the graphThe surplus of labor will lead to unemployment The 10 minimum wage would create an even larger surplus of labor and the unemployment rate would be even higher 500 Employment Lador supply Unemployment Labor demand ...View the full answer

Answered By
Shehar bano
I have collective experience of more than 7 years in education. my area of specialization includes economics, business, marketing and accounting. During my study period I remained engaged with a business school as a visiting faculty member and did a lot of business research. I am also tutoring and mentoring number of international students and professionals online for the last 7 years.
4+ Reviews
10+ Question Solved
Related Book For 

Question Posted:
