

Suppose that the market for marijuana is shown in the accompanying graph, where MC (private) represents the
Question:
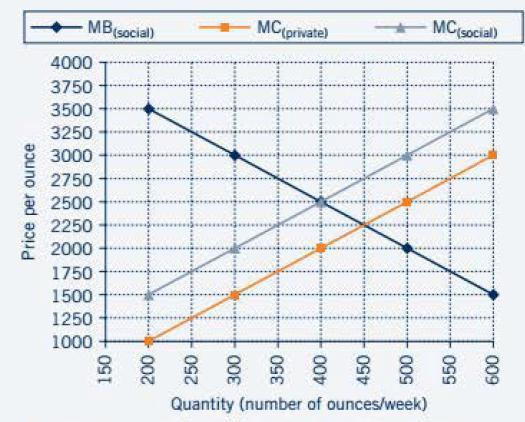
Suppose that the market for marijuana is shown in the accompanying graph, where MC(private) represents the private supply curve and MC(social) represents the social supply curve that reflects the full social marginal costs of marijuana. MB(social), is the demand curve and represents the private and social marginal benefits of marijuana. The gap between MC(social) and MC(private) represents
a. The difference between the private and social benefits of marijuana production and consumption
b. The negative externalities associated with marijuana production and consumption
c. The difference between the market price of marijuana and the actual private cost involved in producing marijuana
d. Producer surplus
e. Consumer surplus
Step by Step Answer:
Based on the image you sent of the market for marijuana the gap between MCsocial and MCprivate represents b The negative externalities associated with ...View the full answer


Introduction To Economics Social Issues And Economic Thinking
ISBN: 9780470574782
1st Edition
Authors: Wendy A. Stock
