

Suppose the demand and supply for sweatshirts are given by: a. Graph these demand and supply curves.
Question:
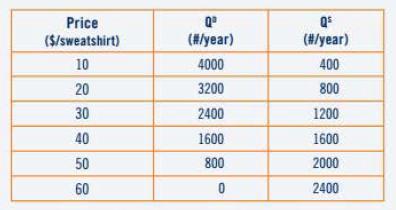
Suppose the demand and supply for sweatshirts are given by:
a. Graph these demand and supply curves. Be sure to correctly label the axes. At what price does equilibrium occur? What quantity is traded at that price?
b. Suppose the price of cotton, a production input for sweatshirts, falls such that at each price, quantity supplied changes by 1200 units. Add the new supply curve to your graph from part a. Label it S'. What is the new equilibrium price? What is the new equilibrium quantity?
c. Draw another graph of the original demand and supply figures. Now suppose that the price of sweatpants, a compliment consumption good to sweatshirts, rises, ceteris paribus. As a result, the quantity of sweatshirts demanded changes by 1200 at each price. Add the new demand curve to your graph. Label it D'. What is the new equilibrium price? What is the new equilibrium quantity?
Step by Step Answer:
Lets address each part of your question individually a To graph these demand and supply curves we need to plot the provided points on a graph where th...View the full answer


Introduction To Economics Social Issues And Economic Thinking
ISBN: 9780470574782
1st Edition
Authors: Wendy A. Stock
