

The accompanying graph shows the demand and supply for computer support workers in the U.S. At equilibrium,
Question:
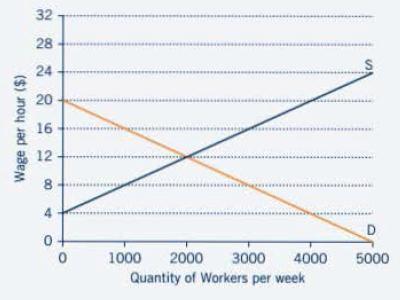
The accompanying graph shows the demand and supply for computer support workers in the U.S. At equilibrium, producer surplus is_______ per week.
a. $12
b. $2,000
c. $24,000
d. $16,000
e $8,000
Fantastic news! We've Found the answer you've been seeking!
Step by Step Answer:
The producer surplus is the shaded area below the supply ...View the full answer

Answered By
Keziah Thiga
I am a self motivated financial professional knowledgeable in; preparation of financial reports, reconciling and managing accounts, maintaining cash flows, budgets, among other financial reports. I possess strong analytical skills with high attention to detail and accuracy. I am able to act quickly and effectively when dealing with challenging situations. I have the ability to form positive relationships with colleagues and I believe that team work is great key to performance. I always deliver quality, detailed, original (0% plagirism), well-researched and critically analyzed papers.
1504+ Reviews
2897+ Question Solved
Related Book For 

Introduction To Economics Social Issues And Economic Thinking
ISBN: 9780470574782
1st Edition
Authors: Wendy A. Stock
Question Posted:
