

The accompanying graph shows the market for education, where MC represents marginal costs of education, MB private
Question:
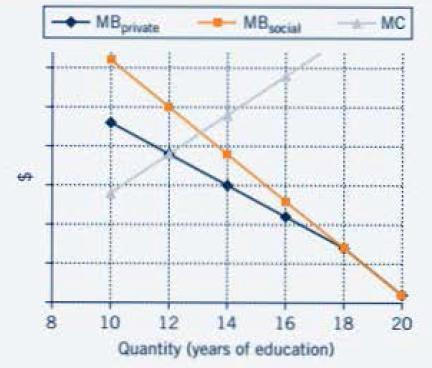
The accompanying graph shows the market for education, where MC represents marginal costs of education, MBprivate is the private marginal benefits of education, and MBsocial, is the social demand curve and represents the social marginal benefits of education. Given the situation depicted in the graph,
a. Without intervention, the market will generate the socially optimal level of education.
b. Without intervention, the market will generate too great a level of education from a social efficiency perspective.
c. Without intervention, the market will generate too low a level of education from a social efficiency perspective.
d. Without intervention, the market won't generate any education production.
Step by Step Answer:
The correct answer is c Without intervention the market will generate too low a level of education from a social efficiency perspective The market for ...View the full answer


Introduction To Economics Social Issues And Economic Thinking
ISBN: 9780470574782
1st Edition
Authors: Wendy A. Stock
