

The graph shows the demand and supply of workers in a given market. The curve S (native)
Question:
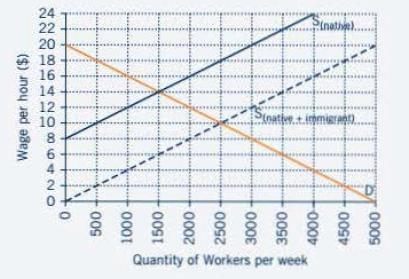
The graph shows the demand and supply of workers in a given market. The curve S(native) represents the supply of native workers in the market and S(native + immigrant) represents the supply of workers in the market after immigration. After immigration, the producer surplus to all workers is_________ per week.
a. $4,500
b. $3,000
c. $500
d. $12,500
Fantastic news! We've Found the answer you've been seeking!
Step by Step Answer:
Producer surplus is the difference between the market price that a producer receives ...View the full answer

Answered By
Jayshree Rathi
Hello Students!
This is Jayshree Rathi. I work on a number of renowned student-centric channels such as Chegg, coursehero, as a certified private tutor.
If you are looking for relevant and original content to complete your assignments, essays, and homework, then contact me and within the promised time, I will deliver you your personalized academic work and help you score the best.
1+ Reviews
10+ Question Solved
Related Book For 

Introduction To Economics Social Issues And Economic Thinking
ISBN: 9780470574782
1st Edition
Authors: Wendy A. Stock
Question Posted:
