

Laufer [5] measured the following data for mean velocity in fully developed turbulent pipe flow at (R
Question:
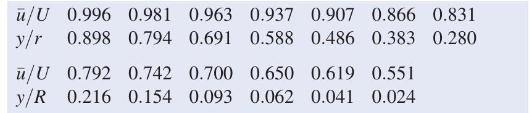
Laufer [5] measured the following data for mean velocity in fully developed turbulent pipe flow at \(R e_{U}=50,000\) :
In addition, Laufer measured the following data for mean velocity in fully developed turbulent pipe flow at \(R e_{U}=500,000\) :
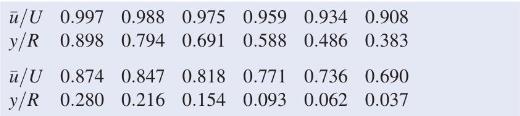
Fit each set of data to the "power-law" profile for turbulent flow, Eq. 8.22, and obtain a value of \(n\) for each set. Do the data tend to confirm the validity of Eq. 8.22? Plot the data and their corresponding trendlines on the same graph.
Step by Step Answer:

This question has not been answered yet.
You can Ask your question!
Related Book For 

Fox And McDonald's Introduction To Fluid Mechanics
ISBN: 9781118912652
9th Edition
Authors: Philip J. Pritchard, John W. Mitchell
Question Posted:
