

Figure 10.4 exhibits a weak positive relationship between % population change, 19902000 and % persons under 18
Question:
Figure 10.4 exhibits a weak positive relationship between % population change, 1990–2000 and % persons under 18 years old, 2000. What does a positive relationship mean in this case?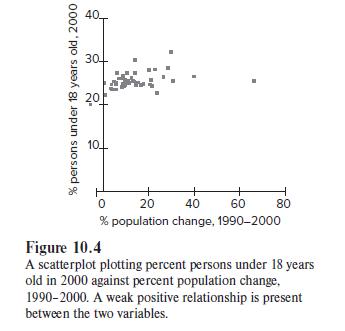
Fantastic news! We've Found the answer you've been seeking!
Step by Step Answer:
A positive relationship between two variables means that as one variable increases the other variabl...View the full answer

Answered By
Amir Khan
I did my masters in mathematics with first division. The university from i did my masters is one of the prestigious university of my country. My academic performance have been quite good. During my masters i was amongst the toppers of the class. Additionally i have been involved in other extracurricular activities also. Doing masters have been quite a rich experience, laden with opportunities to learn something new at every step, chances to better understand my subject and other important lessons. I think my education has equipped me with necessary skills and sufficient knowledge to face challenges of life. With the application and refinement of this acquired knowledge i can excel in my life.
The great Nelson Mandela said," Education is the most important weapon that you can use to change the world". to change the world". In the light of this statement, it can be safely concluded that those individuals who, due to some unavoidable circumstances are deprived of the opportunities to get education are rendered powerless and their potential is diminished. Their thoughts and understanding remain limited. It is the education which makes a person evolve his/her own thoughts and understanding and helps them make an independent worldview, which helps them grow in their respective fields. I think the education that i have got had enabled me to think independently and critically. And what can be better use of knowledge than sharing it with others. Knowledge is the only thing which increases and become refined and broad when shared with others. Sharing of knowledge is the ultimate purpose of getting knowledge. It ensures continued survival and enhancement of knowledge. It is due to this very reason that i love teaching and more so sharing knowledge. That is why i decided to be tutor. I started teaching during my graduation itself and after graduation i started teaching full time.
For the last few years that i have taught, both offline and online, have been an enriching experience. Teaching have taught me a lot, in fact more than what i learned during my college. It has honed my teaching skills and refined my knowledge. Tutoring has exposed the existing gaps in my knowledge and i have tried to bridge those gaps to my best. Tutoring have encouraged me to explore new areas of knowledge in my field itself. It introduced me to new concepts and better ways to impart knowledge. It has taught me better pedagogy skills. I have learnt to make a topic easy and understandable, so as to make its absorption effective and compete. It gives me pleasure when my students are satisfied with my teaching, and they are able understand and grasp what i have taught. i am looking forward to an exciting journey with @solutioinn. I hope it would be a rich and exhilarating experience.
0 Reviews
10+ Question Solved
Related Book For 
Introduction To Geographic Information Systems
ISBN: 9781259929649
9th Edition
Authors: Kang-tsung Chang
Question Posted:
