

How do you interpret a flow accumulation raster (Figure 14.10)? Figure 14.10 A flow accumulation raster, with
Question:
How do you interpret a flow accumulation raster (Figure 14.10)?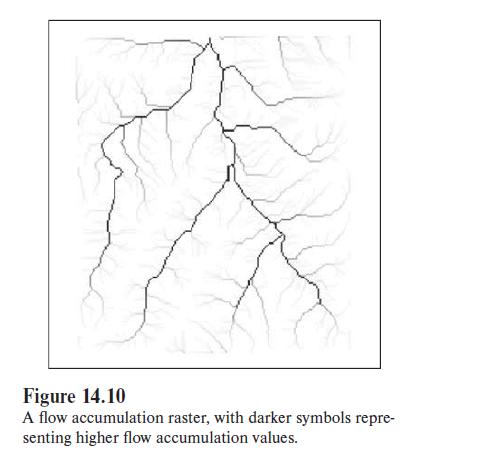
Fantastic news! We've Found the answer you've been seeking!
Step by Step Answer:
A flow accumulation raster is a raster dataset that shows the cumulative number of cells that flow into each cell in a digital elevation model DEM Dar...View the full answer

Answered By
Jonas Araujo
I have recently received the degree of PhD. In Physics by the Universidade Federal do Maranhão after spending a term in Durham University, as I have been awarded a scholarship from a Brazilian mobility program. During my PhD. I have performed research mainly in Theoretical Physics and published works in distinguished Journals (check my ORCID: https://orcid.org/0000-0002-4324-1184).
During my BSc. I have been awarded a scholarship to study for a year in the University of Evansville, where I have worked in detection-analysis of photon correlations in the the Photonics Laboratory. There I was a tutor in Electromagnetism, Classical Mechanics and Calculus for most of that year (2012).
I am very dedicated, honest and a fast learner, but most of all, I value a job well done.
1+ Reviews
10+ Question Solved
Related Book For 

Introduction To Geographic Information Systems
ISBN: 9781259929649
9th Edition
Authors: Kang-tsung Chang
Question Posted:
