

If the sample standard deviations instead of the sample ranges are used to estimate (sigma), the control
Question:
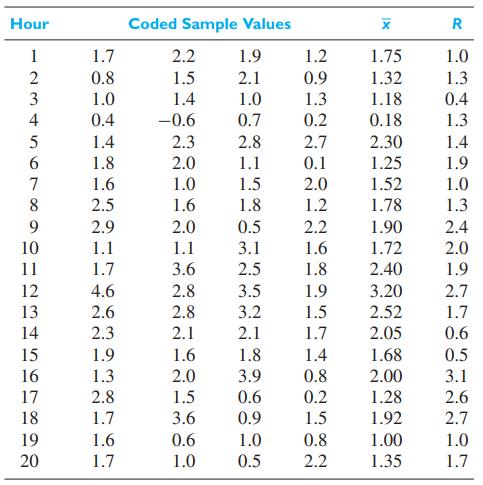
If the sample standard deviations instead of the sample ranges are used to estimate \(\sigma\), the control limits for the resulting \(\bar{x}\) chart are given by \(\overline{\bar{x}} \pm A_{1} \bar{s}\), where \(\bar{s}\) is the mean of the sample standard deviations obtained from given data, and \(A_{1}\) can be found in Table 8W. Note that in connection with problems of quality control the sample standard deviation is defined using the divisor \(n\) instead of \(n-1\). The corresponding \(R\) chart is replaced by a \(\sigma\) chart, having the central line \(c_{2} \bar{s}\) and the lower and upper control limits \(B_{3} \bar{s}\) and \(B_{4} \bar{s}\), where \(c_{2}, B_{3}\) and \(B_{4}\) can be obtained from Table 8W.
(a) Construct an \(\bar{x}\) chart and a \(\sigma\) chart for these samples of size 3 which had \(\bar{x}\) equal to 25, 28, 26, 29,30,32,22,24,27,26,29,20,25,24,27,28,24,23, 27, 28 and \(s\) equal to 1,2,3,5,4,2,1,3,1,4,4,3,2,1,5,4,1,3,2,2.
(b) Would it be reasonable to use these control limits for subsequent data? Why?
Data From Table 8W
Step by Step Answer:


Probability And Statistics For Engineers
ISBN: 9780134435688
9th Global Edition
Authors: Richard Johnson, Irwin Miller, John Freund
