

The MINITAB commands will create a normal scores plot from observations that were set in C1. (MINITAB
Question:
The MINITAB commands
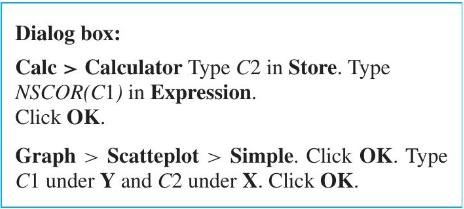
will create a normal scores plot from observations that were set in C1. (MINITAB uses a variant of the normal scores, \(m_{i}\), that we defined.) Construct a normal scores plot of
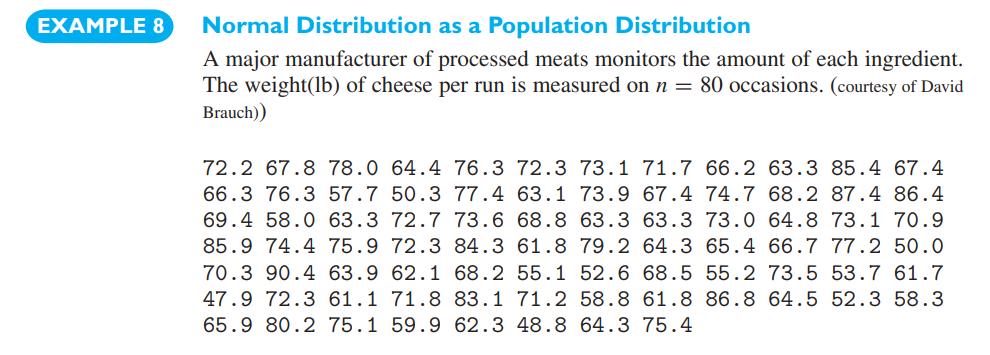
(a) the cheese data of Example 8,
(b) the decay time data on page 156.
Data From Example 8
Step by Step Answer:

This question has not been answered yet.
You can Ask your question!
Related Book For 

Probability And Statistics For Engineers
ISBN: 9780134435688
9th Global Edition
Authors: Richard Johnson, Irwin Miller, John Freund
Question Posted:
