Refer to the three approximations derived for each of the four functions in Exercise 26. For each
Question:
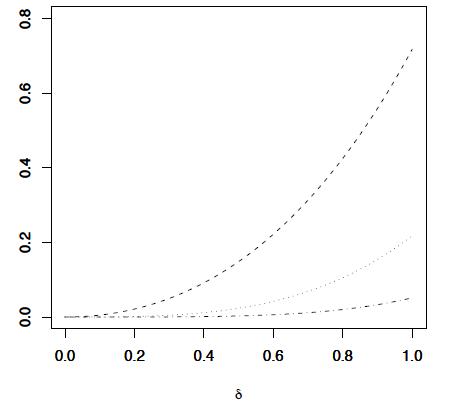
Refer to the three approximations derived for each of the four functions in Exercise 26. For each function use \(\mathrm{R}\) to construct a line plot of the error terms \(E_{1}(x, \delta), E_{2}(x, \delta)\) and \(E_{3}(x, \delta)\) versus \(\delta\) on a single plot. The lines corresponding to each error function should be different so that the plots should look like the one given in Figure 1.4. What do these plots suggest about the errors of the three approximations?
Figure 1.4.
Exercise 26
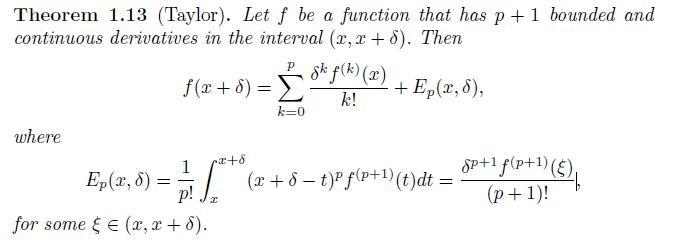
Use Theorem 1.13 with \(p=1,2\) and 3 to find approximations for each of the functions listed below for small values of \(\delta\).
a. \(f(\delta)=1 /(1+\delta)\)
b. \(f(\delta)=\sin ^{2}(\pi / 4+\delta)\)
c. \(f(\delta)=\log (1+\delta)\)
d. \(f(\delta)=(1+\delta) /(1-\delta)\)
Step by Step Answer:

This question has not been answered yet.
You can Ask your question!