

The following set of dotplots with overlaid boxplots gives the number of pairs of flip-flops students said
Question:
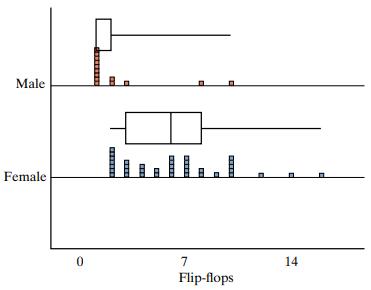
The following set of dotplots with overlaid boxplots gives the number of pairs of flip-flops students said they owned for 13 males (top) and 37 females (bottom) in a statistics class. The five-number summaries for each dataset are also shown below.
Five-number summary for number of flip-flops
Male: 1, 1, 1, 2.5, 10
Female: 2, 3, 6, 8.5, 16
a. What are the median number of flip-flops owned for the males? For the females?
b. Although the female boxplot clearly has two whiskers on each side of the box and clear, separate lines for the two quartiles and the median, why doesn’t the male boxplot have a lower whisker and those same three separate lines?
c. The boxplots are drawn so as not to show any outliers. Summary statistics are also included. Are there any outliers in either dataset? If so which ones? (Explain how you are determining this.)
Step by Step Answer:
a Median number of flipflops for males is 1 and median number of flipflo...View the full answer


Introduction To Statistical Investigations
ISBN: 9781119683452
2nd Edition
Authors: Beth L.Chance, George W.Cobb, Allan J.Rossman Nathan Tintle, Todd Swanson Soma Roy
